Case selection and methodology
Contents
Excerpt from Judith G. Kelley, Scorecard Diplomacy: Grading State to Influence Their Reputation and Behavior, (Cambridge University Press, 2017): 285–90.
Drawing on the interviews and the document analysis, over 15 case studies were crafted to systematically examine evidence for the steps in the scorecard diplomacy cycle to analyze the likelihood of causality between US efforts and observed outcomes.
The cases serve to examine whether scorecard diplomacy sometimes works as purported, whether its possible to figure out some factors that facilitate or hinder it, and to illustrate some of the core mechanisms by probing the occurrence of some of the interaction on the ground. The cases are not selected to test the overall effectiveness of scorecard diplomacy by demonstrating a strong correlation between US efforts and progress.
The case studies are extraordinarily rich due to the availability of the embassy cables, but the availability of information is very uneven over time. This makes it difficult to draw inferences about what happens during times when there is less information and thus to compare countries to themselves over time. The strategy is to focus primarily on the times when information is rich. Thus, the focus usually wanes by early 2010. The information contains variation in outcomes: at times embassies report progress and at other times stagnation, or setbacks. What can be learned about these episodes? How do they fit with the arguments about scorecard diplomacy, and what do they tell us about which other factors are important?
Case Selection
The cases studies are of countries and consider the activities of multiple stakeholders at the international, national, and local levels. Countries were chosen based on and limited by a several factors. First and foremost, because the main source for the information is the diplomatic cables and because the subset of cables released was very uneven across countries, it was important to choose cases that were relative information rich, that is, cases with more cables about trafficking. This likely biases the cases towards countries where the US has been more active, although variation remains. It’s also worth noting that the measure of engagement, namely the share of overall diplomatic cables that are on the subject of trafficking, does not differ statistically between the cases and non-cases. See Table A1.6 for this and other comparison statistics. Second, because legislation has been such a major part of US efforts, it was useful to choose several cases where there were cables when legislation was being discussed in various countries. Another important factor was variation in tier ratings across the cases. Finally, it was useful to have some variation in region and regime type to see whether any differences were apparent.
Table A1.5 overviews the basic characteristics of the chosen cases, including the level of US effort, the range of tiers they received in the years they were included in the report, as well as a measure of how often on average that the US TIP Reports mentioned NGOs or IGOs for each of these countries. It also shows the level and year of criminalization.
| Country | Total TIP documents (% of all available cables for country) |
Year of first documents (first year of TIP report) |
Range of TIP tiers† | Level of criminalization* (years) |
NGO activity** | IGOs activity** |
|---|---|---|---|---|---|---|
| Argentina | 194 (9%) | 2004 (2004) | 2–WL | Full (2008) Strengthened (2012) |
4.5 | 0.75 |
| Armenia | 92 (5%) | 2003 (2002) | 2–3 | Partial (2003) Full (2006) |
4.6 | 0.5 |
| Chad | 43 (5%) | 2005 (2005) | 2–3 | None | 3 | 3.85 |
| Ecuador | 115 (8%) | 2004 (2004) | 2–3 | Full (2005) | 2 | 0.75 |
| Honduras | 131 (7%) | 2002 (2001) | 2–WL | Partial (2006) Full (2012) |
4.63 | 0.63 |
| Indonesia | 151 (5%) | 2006# (2001) | 2–3 | Partial (pre study) Full (2007) |
4 | 0.63 |
| Israel | 82 (2%) | 2004 (2001) | 2–3 | Partial (2000) Full (2006) |
4.36 | 0.09 |
| Japan | 70 (1%) | 2006 (2001) | 2–WL | Partial (2005) | 3.72 | 2 |
| Kazakhstan | 94 (5%) | 2006 (2001) | 2–3 | Partial (2002) Full (2003) |
4.27 | 0.45 |
| Malaysia | 133 (13%) | 2006 (2001) | 2–3 | Partial (2001) Full (2007) Strengthened (2010) |
2.81 | 0.27 |
| Mozambique | 93 (10%) | 2003 (2003) | 2–WL | Full (2008) | 4.22 | 0.66 |
| Nigeria | 179 (6%) | 2001 (2001) | 1–WL | Full (2003) | 2 | 0.45 |
| Oman | 163 (10%) | 2004 (2005) | 2–3 | Full (2008) | 0.28 | 0.71 |
| UAE | 179 (6%) | 2003 (2001) | 1–3 | Full (2006) | 1.45 | 1 |
| Zimbabwe | 38 (1%) | 2003 (2002) | 2–3 | Partial (2014) | 3.55 | 2.44 |
Table A1.5: Overview of case study attributes
NGO activity mean = 2.90, range 0–9; IGO activity mean = 0.81, range 0–4
† WL: Watch List
* Partial indicates some covering laws that did not fully meet the UN Trafficking protocol criteria
** Based on author’s data calculated on average mentions in the annual TIP Reports
# One in 2003
Comparison of Case Study Country Attributes with Non-Case Study Countries
A comparison of policy progress in the case studies versus the rest of the sample is useful. As seen in Table A1.6, the case studies are similar to the non-country cases in most regards, including the perceived level and type of trafficking problem in the early 2000s and the engagement of IGOs and NGOs with the US embassy and TIP. They are similar on other important things such as GDP per capita, population size and aid. The case studies do have a higher level of US engagement as measured in the percent of US cables devoted to the trafficking issue, and also slightly worse tiers, and more news coverage of TIP issues. In general, they are slightly “worse” countries in terms of democracy and corruption, which likely explains the higher engagement—the US clearly does not engage as much with countries consistently rated Tier 1, for example, but it made no sense to included such countries in the case studies. While the chosen cases get more total news coverage, they don’t get more per capita. Similarly, they get more aid, but not per capita. The fact that the cases are more corrupt and less democratic might actually make them less amenable to pressure.
| Statistic | Case study countries | Other countries | Difference | Significant difference at p = 0.05 |
|---|---|---|---|---|
| US TIP effort (% of cables mentioning TIP) | 0.063 | 0.0402 | 0.0228 | Yes, more engaged |
| Tier | 2.24 | 2.02 | 0.219 | Yes, higher tiers |
| Incidence (transit) | 0.933 | 1.5 | -0.563 | No |
| Incidence (origin) | 2.2 | 2.4 | -0.195 | No |
| Incidence (destination) | 2.4 | 2.27 | 0.129 | No |
| Count of NGOs | 3.3 | 2.88 | 0.413 | No |
| Count of IGOs | 1.02 | 0.802 | 0.213 | No |
| TIP media coverage | 113 | 89.5 | 23.1 | Yes, more coverage |
| GDP per capita (constant 2000 dollars) | $8,677 | $6,973 | $1,704 | No |
| Population | 48M | 45M | 3,620,624 | No |
| Corruption | 2.13 | 2.62 | -0.485 | Yes, more corrupt |
| Political rights | 3.98 | 3.44 | 0.542 | Yes, less democratic |
| Aid (OECD) | $14.5 | $230 | -$215 | No |
| Aid (US) | $121 | $96 | $24.8 | No |
| Ratification of 2000 TIP protocol | 0.8 | 0.791 | 0.00915 | No |
Table A1.6: Comparison of case study countries and other countries in years they are included in the TIP Report
How do the selected cases fare in terms of improvements compared to the non-selected cases? Figure A1.4 relies on data from the “3P Anti-Trafficking Policy Index”1 and shows that the countries sampled have overall had greater improvements than the non-sampled countries, partly because they were significantly worse to begin with and because several of the non-sampled countries just started out very high and had little room for improvement. This is consistent with the above and with the desire to be able to learn about the active ingredients of scorecard diplomacy. However, the non-sampled countries have also improved. Thus the chosen cases over-represent improvements, but do not misrepresent the general trend.
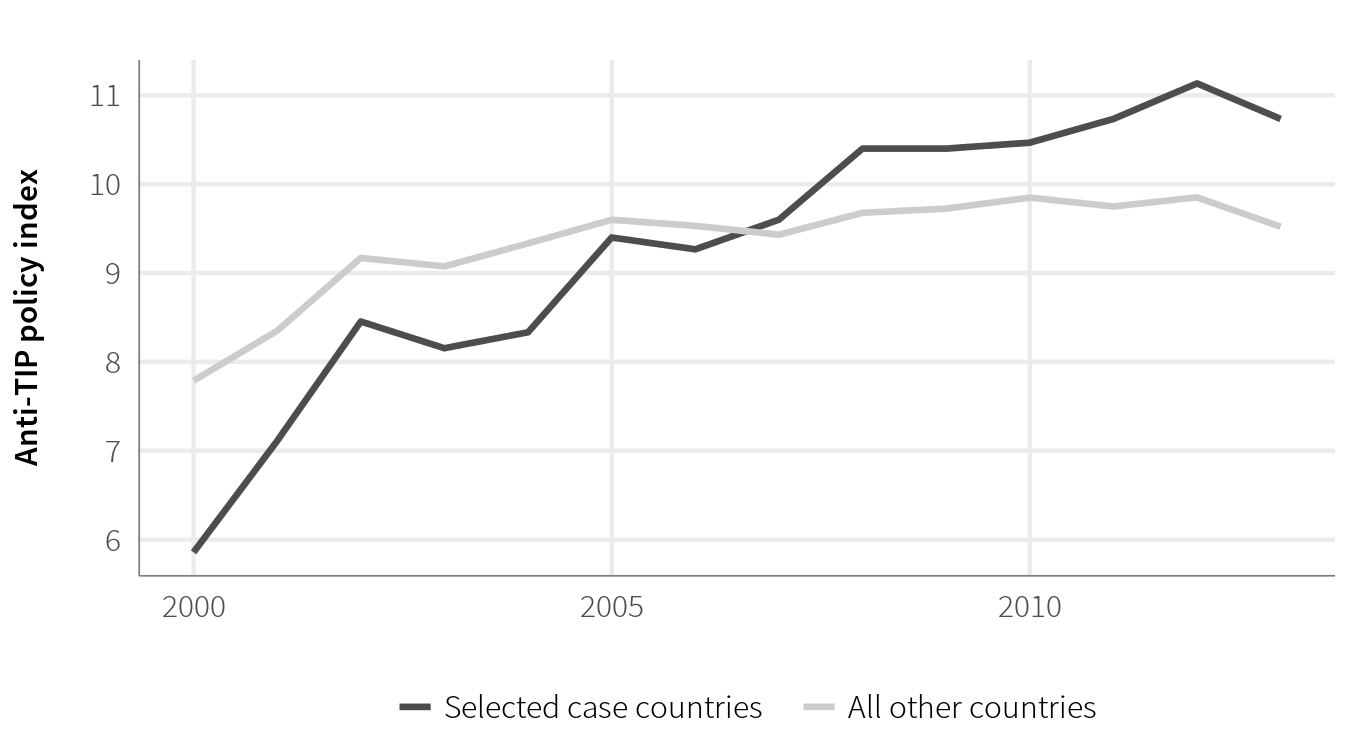
Figure A1.4. Average 3P anti-TIP policy index for 15 case study countries compared to all other countries.
Case Study Methodology
The embassy cables for each country case were loaded into a software program for qualitative analysis called QDA Miner. The cases were read and coded with respect to types of events. Two graduate and two undergraduate students assisted in the coding. Everything was double coded. The coding was very heavily supervised in weekly group meetings and I went over every single case. The codes were not intended for quantitative analysis but to help with the case study analysis. The list of things noted was long, but included things such as:
- Meetings between US and in-country stakeholders, and the level of these officials involved (head of state, ministerial level, other government officials, and NGOs or IGOs).
- Types of US engagement in the country (practical assistance, funding programs, pushing for legislation, etc.).
- Progress on TIP legislation including comments on the implementation of the legislation, wording, updates on political obstacles and so forth.
- Reactions to the reports (as discussed in Chapter 5).
- Things of note, such as whether embassy officials were making claims about the effectiveness of US efforts, arguing for certain tier ratings, making use of conditionality or instructing officials on improvements that would need to be made to reach certain tier ratings, etc.
- The presence and activity of other stakeholders like IGOs and NGOs.
A synopsis was drawn up of the coding categories for each case. Next, the case was filled in as much as possible with other sources, including reports from the UN and other IGOs and NGOs, as well as media accounts and in some instances interviews. The next step was to write up chronologies. Although often long, the chronologies contained uneven information across time due to the variation in the availability of embassy cables and other sources. Nonetheless, during certain periods the cases were often much more detailed than would normally be obtained with standard case study materials due to the confidential nature of the cables. After the chronologies were completed, a longer case study was written, which was then condensed to a shorter version (which is available on the book’s companion site). Examples from the case studies are discussed in context in the throughout the book.
To understand the likelihood that the US brought about the observed outcomes, that is, to draw any causal inference between US actions and policy outcomes, the case studies paid attention to three things in particular: (1) Sequencing, which is important for causal inference.2 (2) Congruence: The substance of US recommendations must relate to the actions taken by a government. (3) Testimony: How the actors involved attribute causality to various outcomes.